By: Brendan Sio, Angel Chen, Eric Oh, Gene Shaffer
File system is a way for operating systems to retrieve or store a file. Without file systems, information stored would be one gigantic piece of data with no way of telling where each file begins and ends.
Disk space – often times, programs are too large to be stored on the RAM. Files provide more space on the disk.
Organization – the file system keeps track of files by using names for easy access.
Performance – efficient search and access of files; high accessibility.
Pattern – an efficient way of organizing files.
Reliability – we want our file system to be robust and secure.
To reach optimal performance, we require an efficient pattern for organizing files. Often times, the organization and implementations clash, thus decreasing efficiency.
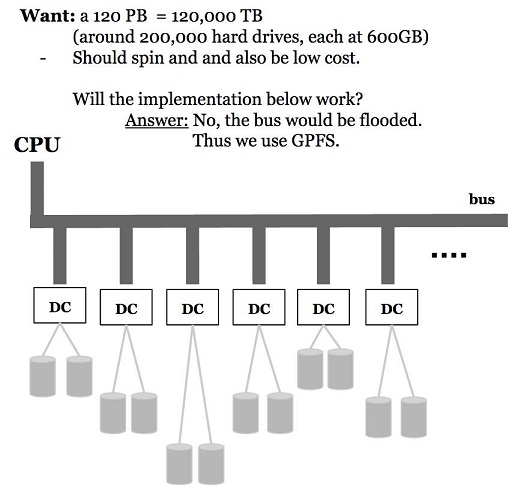
Example: We have 120PB, or 120,000 TB of information. To help visualize, imagine 200,000 hard drives with 600 GB each. We want a storage method that will spin quickly and also be low cost. What can we do to retrieve information?
We cannot have multiple disk controllers attached to one bus because the bus will become flooded. It will be many times worse than the traffic on 405 during rush hour. Retrieval time would increase to almost infinity.
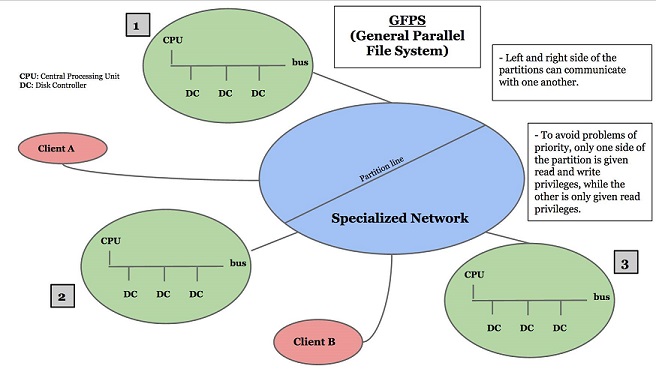
One possible solution is to implement a specialized network with many CPU/bus, each with a reasonable amount of disk controllers attached, along with clients.
Such a network of CPU’s is otherwise known as a General Parallel File System (GPFS).
It is a high performance file system developed by IBM. How is this file system implemented?
Stripes
If the file is gigantic, we don't store the entire file on one disk or on adjacent disks. Rather, we split it into pieces and place it in different places.
The CPU Catalog will then map the files to the different locations, and access it accordingly.
However, this can cause a bottleneck if many files try to open the CPU catalog at the same time.
To solve this problem, we use:
Distributive Metadata
Instead of using a central catalog, we stripe the CPU catalog itself to fix the bottleneck issue.
Metadata is data that contains information about a file, such as the file location, owners, and timestamp. Distributed metadata consists of many nodes in the file system, with each node containing more metadata. There isn’t a singular “control” node, but rather, a cloud of nodes. This allows metadata to be easily and quickly accessed.
Efficient Directory Indexing
The directory is a structure that holds many files. While searching through all files, having O(n) indexing, where n is the number of indexes, is unacceptable. It would be too slow. Ideally, we would want it to be O(1). But how could we implement this efficiently?
Possible structures spawning from discussion were: hash table, balanced binary search tree, or a 2-3 tree.
Using a hash table would require us to know the exact amount of files in advance. The user would have no flexibility.
The balanced binary search tree is not a good option simply because indexing can be often random, and to sort the entropy into a BST is inefficient/counteractive. There are also many other structures that may or may not be effective.
Distributed Locking
Distributed locking uses an arbitrarily named lock in which only one application can own at a time. It can be used to coordinate access to shared files. However, this is harder to implement.
Partition Awareness
Sometimes data is partitioned, or split, and we would need to be aware of how we partition our files. When a system has network partition awareness, the largest partition has priority and stays live. This partition has both reading and writing privileges. Conversely, the smaller partitions are “frozen” and only has reading privileges. If the two partitions were looking at the same file and both tried to edit that file, then network partition awareness will guarantee that the file will not become corrupted.
File system must stay live during maintenance
There are times when users are unable to connect to a server, such as the SEASNet Linux server, because they are doing maintenance on it. If the server could stay live during maintenance, this could be more convenient for users; however, it would be harder to implement because some user actions taken during maintenance could potentially be dangerous for the server or file system.
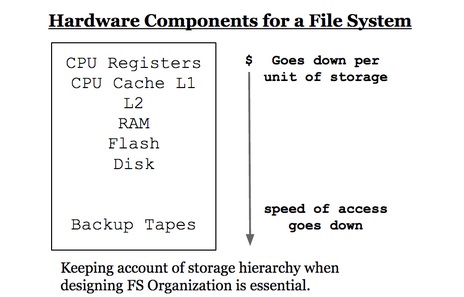
When designing a file system organization, we must take into account storage hierarchy. In Linux, the root folder is the parent of all files. Its children include the Home folder, Documents, etc.
When choosing a data structure for (the CPU catalog?), Hash tables and binary search trees come to mind. BST does not take into account of storage hierarchy and is not recommended.
Depth of memory access - how far we go into memory to get the information. The deeper the memory, the longer the turnaround time to access a file.
Throughput is how many bytes/seconds can be transferred in I/O. It determines the load time of copying data from file into RAM.
Latency is the turnaround time for 1 request. We can think of it in terms of this question: "If a request is sent to file system, how long before we get a response?"
The waterbed effect actually helps in this case. If we increase throughput, latency would decrease. Throughput is to yin as Latency is to yang.
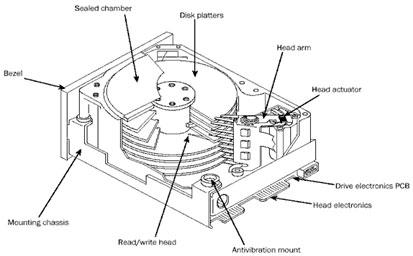
Performance Implications of a disk (5400-15,000 rpm)
Note: Steps 2-4 have to be done sequentially, they cannot be done in parallel
| Action | Time (in μs) |
| Send Command to Device | 5 |
| Device Latency | 50 |
| Read Latency | 40 |
| Computation (useful work) | 5 |
Batching: to increase buffer size and read bytes in big blocks
char buf[40] <- change 40 to 840
read 40 840 bytes //840 = 21*40
| Action | Time (in μs) |
| Send Command to Device | 5 |
| Device Latency | 50 |
| Read Latency | 840 |
| Computation (useful work) | 105 |
latency: send command 5 µs + device latency 50 µs + read 840 µs + compute 105 µs = 1000 µs
throughput = 21 requests/(1 ms = 1000 µs) = 21000 requests per second (gone up by a factor of 21)
We saved time because we only send command to device once and account for device latency once.
utilization: 105 µs /1000 µs = 10.5%
*Batching is an attack on the device latency
Multitasking: while we wait for the device to be ready, let someone else run (under the assumption that there are multiple tasks to be done)
This only improves performance when the previous assumption is true.
| Action | Time (in μs) |
| Send Command to Device | 5 |
| Handling Interrupt | 5 |
| Check if read | 1 |
| Read Latency | 40 |
| Computation (useful work) | 5 |
latency: send 5 µs + block 50 µs + handle interrupt 5 µs+ check if ready 1 µs + read 40 µs +
compute 5 µs = 106 µs (6 us added because of handle and check)
throughput: 1/56 µs = 17,857 req/s (assumes 50 µs from block is used to do useful work)
utilization: 5/56 = 8.93%
DMA To Improve Performance: tells device controller where to put data
DMA is an attack on the read time of 4o us.
*shrinks 40 us; no read instruction time since data is taken directly out of RAM
| Action | Time (in μs) |
| Block Latency | 50 |
| Handling Interrupt | 5 |
| Check if Ready | 1 |
| Computation (useful work) | 5 |
latency: block 50 µs + handle 5 µs + check if ready 1 µs + compute 5 µs = 61 µs
(Now the handle is the biggest bottleneck in DMA method so we will try to get rid of interrupts by changing program not to use them at all)
throughput: 1/11 µs = 91,000 req/s
utilization: 5/11 = 45%
| Action | Time (in μs) |
| Yield() | 50 |
| Check DMA Slots | 1 |
| Computation (useful work) | 5 |
| Method | Latency (μs) | Throughput(Kb/s) | Utilization |
| Polling | 100 | 10 | 5% |
| Batching | 1000 | 21 | 10.5% |
| Interrupts | 106 | 18 | 8.9% |
| DMA | 61 | 91 | 45% |
| DMA w/polling | 56 | 167 | 84% |
DMA w/polling seems to be the best result; However, this is because the size of jobs are same and come in an assembly line like manner.
Synchronized problem; Workflow is regular.
For General Purpose systems like Linux, it is not the best because everything is randomized, thus no regularity.
Useful for special embedded programs.