File systems need: Disk space, addresses, organization, performance, & reliability.
Example of how files are stored:
For a system of 120PB = 120,000TB. 200,000 hard drives (each 600GB)
File systems need: Disk space, addresses, organization, performance, & reliability.
Example of how files are stored:
For a system of 120PB = 120,000TB. 200,000 hard drives (each 600GB)
--------------------------
*Stripes| 1 | 2 | 3 | 1 | 2 | ...
--------------------------
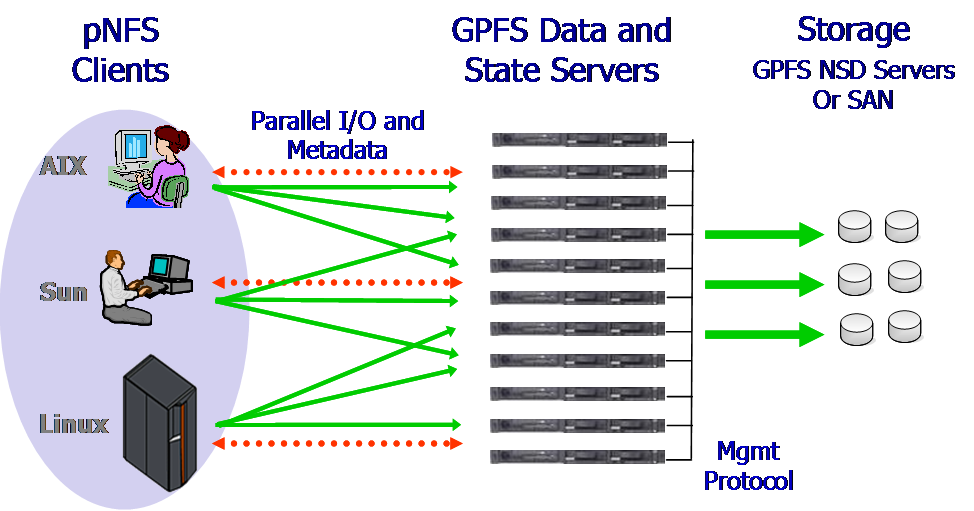
*Distributed Meta-data (No Central Catalog)
*Efficient Directory Indexing
Binary Tree or 2-3 Trees
*Distributed Locking (Harder to implement)
*Partition awareness
*File system stays alive during maintenance
| Component | Speed | Price per unit |
|---|---|---|
| CPU Registers | Fastest | Very Costly |
| CPU Cache L1 | Fast | Costly |
| CPU Cache L2 | Less Fast | Costly |
| CPU Cache L3 | Slow | Costly |
| RAM | Slower | Less Costly |
| Flash | Even Slower | Cheap |
| Hard Disk | Much Slower | Cheaper |
| Backup Discs/Tape | Slowest | Cheapest |
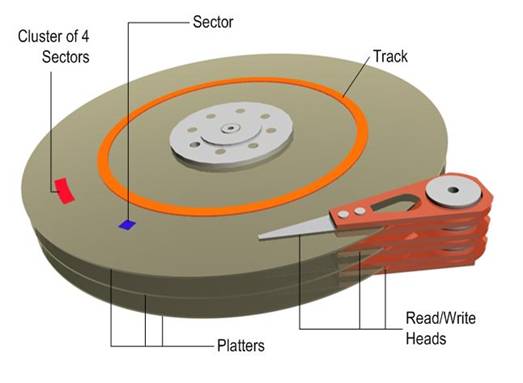
A Disk typically spins at 5400-15,000 RPM
| Seagate Barracuda ES2 1TB | Corsair Force GT (SSD) | Description |
|---|---|---|
| 16 MB | N/A | Cache - amount of memory the disk drive has |
| 7200 rpm = 120Hz | Does not spin | Rotation speed - how fast the disk drive spins |
| 8.333 ms | N/A | Rotation time - worst rotational latency |
| 4,166 ms | N/A | Average rotational latency |
| 8.5 ms | N/A | Average read seek |
| 9.5 ms | N/A | Average write seek - Longer than read seek time because it requires precise positioning |
| 0.8 ms/1.0ms | N/A | Track-to-track seek - Moving between tracks |
| 1.29 Gb/s | N/A | Maximum internal transfer rate - Rate at which data comes off the disk and onto the cache. |
| 3 Gb/s | 3 Gb/s | External transfer rate - Rate at which you transfer data from the disk controller cache to the bus |
| 12.5 W | 2.0W | Typical running wattage |
| 9 W | 2.0W | Idle- Average wattage |
| 1.2 Million hours | 1.0 Million hours | The estimated total lifespan of the drive |
| 0.73% AFR | N/A | annualized failure rate - Estimated value, yearly failure rate if used 24/7 |
| Non-recoverable read failure rate of 10^-15 percent | N/A | Probability that the disk will lose the sector |
| A couple of Gs | 1000G | Shock resistance |
| 105 MB/s Read / 95 MB/s Write | 280 MB/s Read / 270 MB/s Write | Transfer Rates |
for(;;) {

					char buf[40];

					//*Read 40 bytes from device to buf

					compute(buf);

}for(;;) {
char buf[840];
//Read 840 bytes
compute(buf);
}for(;;) {
//Send command to controller
do { Block until interrupt
handle interrupt } while(!read)
//read buffer(40 bytes)
compute(40);
}for(;;) { //DMA+Polling
while(DMA Status' Busy)
yield();
}
}Latency = 50 μs(yielding) + 1 μs(Check DMA) + 5μs(Compute) = 56 μs
Throughput = 1/6 = 166,667 Requests/Sec
Utilization = 5/6 = 84%
| Method | Latency(μs) | Throughput(kb/s) | Utilization(%) |
|---|---|---|---|
| Polling | 100 | 10 | 5 |
| Batching | 1,000 | 21 | 10.5 |
| Interrupt | 106 | 18 | 8.9 |
| DMA | 61 | 91 | 45 |
| DMA+Polling | 56 | 167 | 84 |