CS 111: Lecture 10 Scribe Notes


Jeannie Nguyen & Emily Im
FILE SYSTEMS:
We want to have good performance from our file systems, but how do we measure how "good" our performance is?

Metrics for Performance:
  • Latency: The delay from request to response time.
  • Throughput:The rate of request completion
  • Utilization:The fraction of time that the I/O system is actually doing I/O
  • - We can maximize the throughput by getting utilization as close to one hundred percent as possible.
  • Capacity: The amount of data the file system can hold
  • Transfer Rate: The speed at which the data travels from one file system to another. This is a lower level measurement.
  • Typically, better performance is characterized by low latency, high throughput and high utilization.

    Our Example Device:
    Assume we have a device with the following characteristics:
  • CPU Cycle Time: 1 nanosecond
  • Programmed I/O (PIO) : 1 microsecond (1000 cycles)
  • Send command to device: 5 microseconds (5 PIOs)
  • Device Latency: 50 microseconds
  • Computations per buffer: 5 microseconds (5000 cycles)
  • Read 40 bytes from device: 40 microseconds (40 PIOs)

  • The "Naive" Method
    Now, let's consider trying to run the following code on this device.

      for(;;)
      {
          char buf[40];
          read 40 bytes in buf;
          compute(buf);
      }

    We break-up the calculations of the latency, throughput and CPU utilization as follows:
      Latency (microseconds) = time to send command (5) + device time (50) + read time (40) + time to compute (5) = 100 microseconds
      Throughput = 1 / Latency = 10,000 requests/second
      CPU Utilization = time to compute / Latency = 5 / 100 = 0.05 = 5%

    Batching
    The naive method above is simple, but performance is slow. Rather than reading in one byte at a time, we can read and compute them in batches. This increases our utilization.

      for(;;)
      {
          enum { BATCHSIZE = 21};
          read 40 * BATCHSIZE into buffer;
          for(int i = 0; i < BATCHSIZE, i++)
                compute(buf + 40 * i);
      }

      Latency (microseconds) = time to send command (5) + device time (50) + read time (40*21) + time to compute (5*21) = 1000 microseconds
         -Though, the actual latency here is staggered.
         -Actual Latency = first buffer (950) + ... + last buffer (5)
      Throughput = 1 / Latency = 50 / 1000 (40-bit requests/s) = 21,000 40-bit requests/s
          -This is because each request has a size of 20.
      CPU Utilization = 105 / 1000 = .105 = 10.5%

    Interrupts
    We can further increase performance by using an interrupt handler with our batching process such that the IO access and computation runs in parallel.

      for(;;)
      {
          write command to device;
          while(!ready) continue;
          read data from devices
          compute;
      }
      do
      {
          wait for interrupt (CPU stalls)
          handle interrupt
      }while(!ready)

      Latency (microseconds) = time to send command (5) + wait for interrupt (50) + handle interrupt (5) + check ready (1) + read (40) + compute (5)                             = 106 microseconds
      Throughput = 1 / 56 (microseconds) = 17,857 requests/s
      CPU Utilization = 1/56 (microseconds) = 8.9%

    Direct Memory Access (DMA)
    Using interrupts leads to some improvement, but can create a bottleneck. We can avoid this bottleneck using direct memory access. Direct memory access allows the file system to perform computations while the controller accesses the memory directly.

      for(;;)
      {
          issue a write command to the device
          handle interrupt
          block until the interrupt
          check that device is read
          computation
      }

      Latency (microseconds) = block(50) + handler(5) + check(1) + compute(5) = 61 microseconds
      Throughput = 1 / 11 (microseconds) = 91,000 requests/s
      CPU Utilization = 5/11 (microseconds) = 45%

    Direct Memory Access with Polling (DMA)
    Now, rather than blocking, we implement DMA using polling. This allows us to avoid the overhead from blocking interrupts. Polling, however, eats up more resources than blocking.

      for(;;)
      {
          issue a write command to the device
          handle interrupt
          while(DMA slots not ready)
            schedule;
          check that device is read
          computation
      }

      Latency (microseconds) = block(50) + handler(5) + check(1) + compute(5) = 56 microseconds
      Throughput = 1 / 6 (microseconds) = 166,666 requests/s
      CPU Utilization = 5/6 (microseconds) = 84%

    Method Latency (microseconds) Throughput(40-kB/s) Utilization
    The "Naive" Method 100 10 5%
    Batching ~1000 21 10.5%
    Interrupts 106 18 8.9%
    DMA with Interrupts 61 91 45%
    DMA with Polling 56 167 87%
    Review of Disk Performance
    Disk Latency comes from:
    1. Seek Time:
    2.       a. Accelerating the read head to the correct track
            b.Decelerating the read head as it gets close to the target track
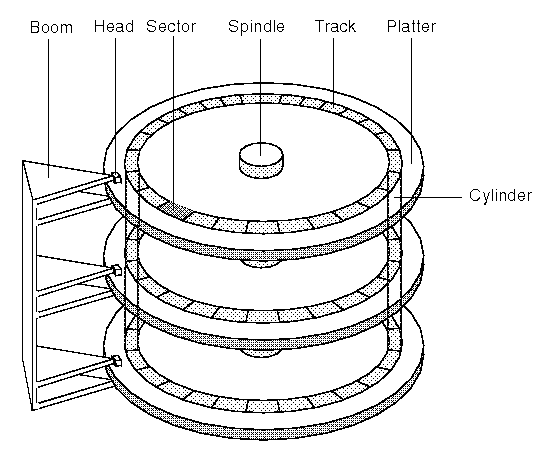
    3. Rotational Latency: Waiting for data to come under the head
    4. Reading the data as it rotates under the head -> controller RAM
    5. Transferring data from controller RAM via bus to desired location
    Typical Disk Performance
    Seagate Barracuda ES2 1TB ("nearline storage")
    • 16MiB cache
    • Average Rotational Latency : 4.15 ms
    •       7200 rpm drive = 120 Hz --> one disk cycle = 1/120 s = 0.00833 s = 8.33 ms = 4.16 * 2 (1/2 becaue of average)
    • Average Read Seek Time : 8.5 ms
    •       -Track to track = 0.8 ms
    • Average Seek Time : 9.5 ms
    •       -Track to track = 1.0 ms
    • 1287 MB/s maximum internal transfer rate
    • 116 MB/s maximum sustained transfer rate
    • 3GB/s external transfer rate (SAS)
    • 12.5 W typical operation
    • 9.0 W idle
    • 1.2 million hours mean time to boot time failure
    • 0.73% AFR Anuualized Failure Rate (24x7)
    • 10E-15 Nonrecoverable sector read failure rate
    Be wary of the average seek time and the average read seek time. These have the potential to be large bottlenecks.

    Basic Ideas for Improving Performance

    Prefetching: This requires acquiring data from the device and placing it into RAM cache before an application requests it. This can be done within the application itself (such as in the batching example), within the OS, or in the disk controller.
    Speculation:Preemptively do work in hopes that it'll improve performance later
          -eg.Move the disk arm to the middle of an idle drive
    Batching: (for Reads)
    Batching: (for Writes) Cache information we want to write into the kernel. Then, fill up the buffer until it is entirely full before sending it to the disk.
          -Downside: Data is not actually on persistent storage
    Dallying: Rather than writing imeediately, wait a certain period of time first.This can save work when the file system is doing work for multiplie applications. By grouping related tasks together, we can avoid excessively moving the disk arm.

    While each method benefits performance in some way, they do have their own disadvantages. Speculation can hurt performance if, for example, it moves the arm to a spot that is actually further from the desired location. Prefetching can waste RAM or tie up the disk unnecessarily.

    Locality of Reference

    Locality of Reference deals with the patterns within data requests, which can be used to predict future requests. We can utilize these localities to increase efficiency.

    Spatial Locality: Predicts data access based on where they are located in memory. For instance, if we access the ith block, it means it is very likely that we will next access the i + delta block.
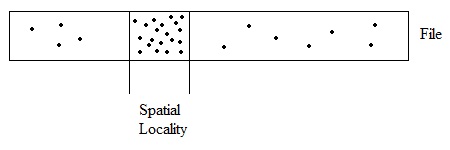
    Temporal Locality: Access at a certain time t implies there will be access at time t + delta. Essentially , we can dally and wait for more requests then retrieve them all at once.

    There is a key assumption that we are making here. Cache Coherence: We assume our caches of disk data are accurate. However, this gets increasingly difficult as the number of CPUs grows.

    SOURCE: Image 1
    SOURCE: Image 2