Deadlock has four conditions:
1. Circular Wait: A circular wait occurs when a chain of processes loops to itself
2. Mutual Exclusion: When one process holds a resource, it excludes other processes from using it
3. No preemption of locks: There is no ability to move processes with locks to the side (no interrupts)
4. Hold and Wait: There is a possibility of one process holding one resource while waiting for another resource (There must be at least two locks)
To never have deadlock, design a system to prevent one of the conditions above. The most popular condition to attack is the circular wait in design. When a process starts to wait, it checks to see if it will create a cycle on each wait operation.
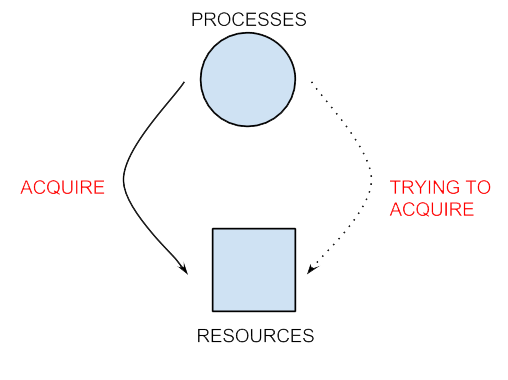
(The first picture is a legend explaining what each of the objects means)
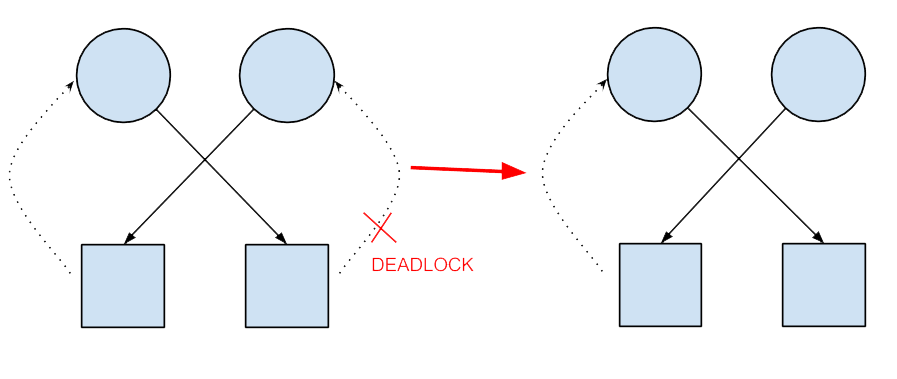
The picture on the left shows a deadlock situation, where each of the processes is attempting to obtain a resource the other process has locked. This causes a deadlock since neither of them will be able to continue, as they are waiting on each other. The right side shows a fixed version where the system attacked circular wait. The system does not allow the process to wait on the right resource because that would cause a cycle.
Another possible solution is lock ordering. This prevents the hold and wait condition. One way of doing this is by processes lock resources in increasing order (increasing in terms of machine address is used commonly). Then, if you find a busy lock, release all of your current locks and start over. This has an O(1) run time solution, but needs to assume that all programs and processes will behave well and always follow rules. It also forces the user to lock in restricted orders, which will make it more difficult to program applications.
Quasideadlock is a case where the system is not technically in deadlock, but is essentially stuck and might as well be in deadlock. For example, the Mars pathfinder in 1997 used priority inversion, which led to a quasideadlock situation. The situation occurs when there are three threads with unique priority levels; the events happen as follows:
1) Low priority thread (LPT) acquires a resource R
2) The kernel context switches to high priority thread
3) High priority thread (HPT) also wants to acquire R, so it waits until it is unlocked
4) The kernel context switches to medium priority thread (MPT)
5) Suppose the MPT does not need any resources, so it can keep running forever
6) However, it shouldn't because HPT still has tasks to do, but is stuck waiting for LPT to release the lock. The problem arises because the current running thread MPT is of higher priority than the thread that HPT is waiting on.
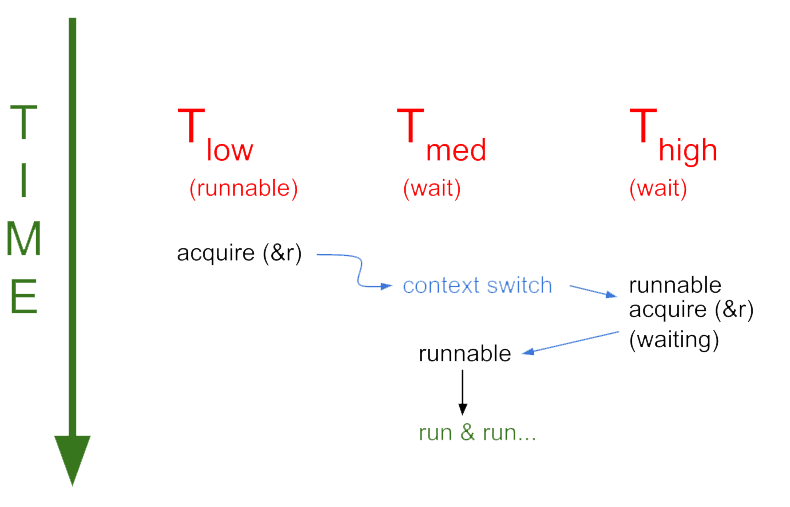
When a high priority thread waits on a resource, the priority of whoever holds the resource becomes of the same priority until it releases the lock. This allows even low priority threads to run, so that the high priority thread will be able to use and lock the resource eventually instead of being blocked by a medium priority thread.
Livelock is also similar to deadlock. However, the states of the processes that are in the livelock will change, but none will ever progress. For example, it might occur in a bounded buffer request. A bounded buffer request is when there are two routines, an interrupt service routine (ISR) and a work routine (WR). The ISR is high priority and requires the CPU's attention to deal with incoming requests. The WR is low priority and is where the CPU actually performs the requests. In reality, requests flow into the buffer at a much higher rate than the CPU can perform them. This means that once the rate of requests passes a certain point, the CPU will be tied up dealing with the requests and has little or no resources to perform any of the requests themselves. As a result, the amount of work done decreases.
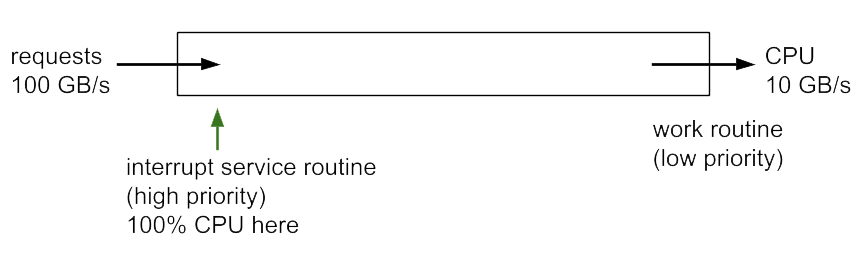
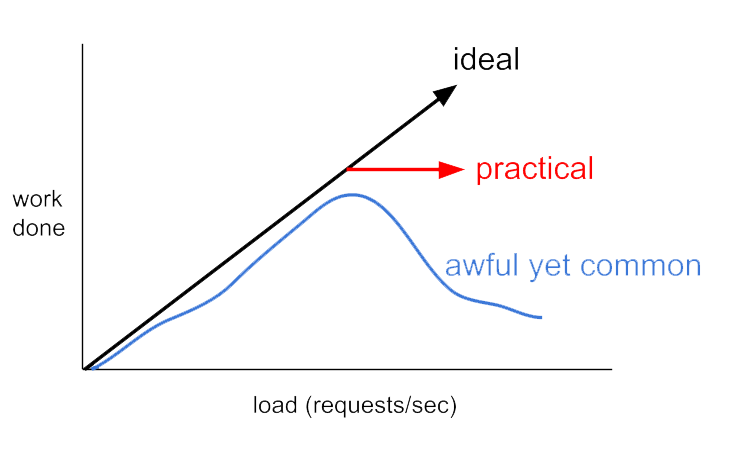
One solution is to enable the work routine to choose to ignore the interrupt service based on how full the buffer is. This way, the CPU's resources can be focused on actually completing tasks instead of wasting time answering interrupts that it won't be able to complete anyways.
The basic problem for all of these issues is that there are at least two threads running in parallel.
Let's just use one thread instead! However, we still want to be able to wait for other events. This leads to event-driven programming:
    main program:

       while(true)

       {

       wait for some event e

       e->handler(e)

       //handlers never wait; they must complete quickly

       }

    }
Positives
No locks
No deadlocks
No bugs due to forgetting to lock
Negatives
Handlers are restricted: The handlers are required to have short runtimes; in order to accomplish this, longer handlers might be required to be broken up into smaller handlers.
It can't scale via multithreading (SMP-shared memory). Instead, it scales via multiprocess or multisystem.
    lock:

      movl $1, %eax

    try:
the
      xacquire lock xchgl %eax, lock //lock atomically

      cmp $0, %eax

      jnz try

      ret

    unlock:

      xrelease movl $0, lock

      ret
Essentially, if xrelease is true (lock succeeds), it pushes the cache to RAM, or keeps the changes. Otherwise, it deletes all the work, as if the process never ran, and tries again.
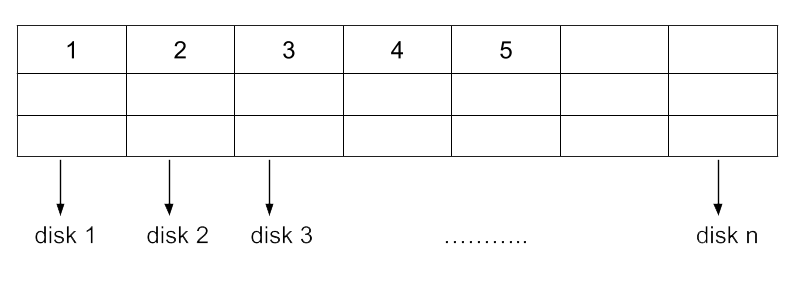
Example File System:
120 PB Total Space
200,000 hard drives, each with 600 GB space
Using GPFS: General Parallel File System
Striping is the idea that a single big partition's data can be broken up and stored on multiple drives. The data is split so that information stored on a single drive is not contiguous. This allows the file system to speed up access times because it can utilize multiple drives to read from different parts of the partition simultaneously.
Metadata includes information such as a file's: location, ownership, timestamp, etc.
Distributed metadata means that the metadata for the files on a file system is contained on a cloud of nodes. The reasoning behind this is that by having multiple copies of the metadata across different nodes, we can reduce the bottleneck in finding the metadata of a file.
Suppose we had a single directory with 10,000,000 files in it. We need to make sure that the file system uses an appropriate data structure such as a B+ tree in order to deal with the large amount of files
Suppose we have a set of clients and nodes. If the partition is split for some reason, then the largest partition will stay live, while the rest will have the wait to reconnect. The clients not in the largest partition will be disconnected until the partition is connected. Usually, only one client loses network, so it works well.
One requirement would be for the file system to stay accessible even during maintenance. We do not want users to be unable to access the file system during maintenance times. For example, myUCLA is (partially) usable during maintenance, so students can still use basic functions during maintenance.
Some performance metrics are:
1. Latency: Delay from request to Response (turnaround time)
2. Throughput: Rate of request completions
3. Utilization: Fraction of capacity doing useful work
We will assume a file system with the following characteristics:
| Action | Time Spent |
|---|---|
| CPU cycle times | 1 ms |
| PIO | 1000 cycles = 1 μs |
| Sending a Command to SSD | 5 PIOs = 5 μs |
| SSD Latency | 50 μs |
| Computation per Buffer | 5 μs |
| Ex. Reading 40 bytes from SSD (40 PIOs) | 40 μs |
| Block Interrupts | 50 μs |
for(;;){
Latency:
char buf [40]
read 40 bytes from SSD into buf;
compute(buf)
}
| Action | Send Command to SSD | SSD Latency | Read Latency | Computation (Useful Work for Utilization) |
| Time (in μs) | 5 | 50 | 40 | 5 |
= 100 μs for each iteration
Throughput = 1/latency = 10,000 requests/second
Utilization = 50,000/1,000,000 = 5%
Key Idea: Increase the buffer size and read more bytes at once.
for(;;){

   char buf [840];

   read 840 bytes

   for(i=0; i < 21; i++)

   compute(buf + i * 40);

}
| Action | Send Command to SSD | SSD Latency | Read Latency | Computation (Useful Work for Utilization) |
| Time (in μs) | 5 | 50 | 840 | 105 |
= 1000 μs for each iteration
Throughput = 21 requests/μs = 21000 requests/second
Utilization = 105/1000 = 10.5%
This will have a higher throughput and utilization because we are reading more data from the SSD during each iteration. The latency will be higher for each read from the SSD since we are reading more data, but we are able to compute more data without having the send a command to the SSD and wait for the SSD latency.
Key Idea: If we can't read from the disk right away, tell the kernel to wake us up when the disk is ready.
    for(;;){

       block until there's an interrupt;

       do

        handle interrupt;

      while(!ready);

    }
| Action | Send Command to SSD | Block Latency | Handle Interrupt | Check if Ready | Read Latency | Computation (Useful Work for Utilization) |
| Time (in μs) | 5 | 50 | 5 | 1 | 40 | 5 |
= 106 μs for each iteration
Throughput = 1/56 μs = 17857 req/s //block + handle + check
Utilization = 5/56 = 0.0893 = 8.9%
There is a slightly higher latency than busy wait and polling, but the throughput and utilization are also slightly higher. This only needs to factor in the block latency, handling the interrupt, and ready check since they are done in parallel with the other parts.
Key Idea: Give the command to the disk controller, and wait until the disk is ready; we can do other useful work in the meantime.
while(1){

   write command to disk;

   block until interrupt;

   check disk is ready;

   compute;

}
| Action | Block Latency | Handle Interrupt | Check if Ready | Computation (Useful Work for Utilization) |
| Time (in μs) | 50 | 5 | 1 | 5 |
= 61 μs for each iteration
Throughput = 1/11 μs = 91000 requests/second //handle + check + compute
Utilization = 5/11 μs = 45%
This has the highest throughput and utilization, along with a fairly low latency. In DMA (direct memory access), the CPS operates in parallel to the IO, so handle, check, and compute are done in parallel to the CPU work.
Key Idea: Instead of wasting time checking / handling an interrupt, just let the kernel wake us up when the data is ready.
while(DMA slots not ready){

   schedule();

compute;

}
| Action | Schedule | Check Disk | Computation (Useful Work for Utilization) |
| Time (in μs) | 50 | 1 | 5 |
= 56 μs for each iteration
Throughput = 1/6 μs = 166,667 requests/second
Utilization = 5/6 = 0.8333 = 84%
This has the largest throughput and utilization, with a fairly low latency. We don't include schedule time in the calculation because scheduling does not play a role in computing the data.