

Abstract
This paper describes developing new computer-based materials for education.
systems involving mathematics to elementary school students.
. Examples included could be used to support teaching basic
Implementation and Course Work -- by Gavin Wu
The platform for the system was the World Wide Web. I worked with Dr. Klinger on a pre-existing web page located at: http://www.cs.ucla.edu/csd-lanai/fweb/cs190/ called the CS190 web site. Using a separate computer science account located at: http://www.cs.ucla.edu/~gavin, I experimented with the documents Dr. Klinger produced, and modified a few of them for aesthetic content. I also helped Dr. Klinger with some HTML document coding, and provided general assistance with the language. Other duties included scanning in multiple images onto the web and converting them to picture files that were readable on the web. Sometimes the manipulation of these files was necessary to eliminate stray marks, text, etc. Scanning sessions also involved taking pictures of multiple objects with a digital camera, and writing these picture (PICT) files onto a
CD-ROM. Unfortunately, we could not get these files into a web-readable format.
The CS190 web site turned into the "computer based system" specified in the purpose. There are several mathematical papers, concepts, problems, and puzzles within the overall structure of the site. In the beginning, the site was primarily text-based. There were some links to pictures (TIF files) of polyhedrons, platonic solids, and some figures, but nothing else. To attract more users, I felt the site needed to be more visually stimulating.
Using Adobe Photoshop, I created a logo for the page, then attached it and a background to the HTML index document for the site. Using some separators and table structures within this document, I ordered the data and links into a more aesthetic fashion. Dr. Klinger built upon these improvements later on and added some images of his own as links, as well as several other table structures to create quite an impressive overall look (See Appendix A ).
I edited a few other documents in the same fashion, creating pages that were easier to read and understand. This portion of the project correlates to "developing the computer-based system." The main objective of my contributions was to make the site more appealing to younger generations. I felt that visual stimulation greatly influences interest, as I will explain in further detail in the section "Importance of Visuals."
For the objective "to develop math-related visually-stimulating computer graphics and / or animation," I created several visuals and figures to supplement Dr. Klinger's work. These will be introduced and explained in the section "Importance of Visuals." I also wrote some C code that would perform Common Gateway Interface (CGI) operations, and allow the user to input on our page. I will elaborate on this part of the project in the section "The Common Gateway Interface."
Conclusions and Learning Accomplished Traditional Thought vs. Creative Thought
Through the course of life and learning, people naturally develop set ways of thinking about certain things. In the field of mathematics for example, we learn that logic and common sense are the key ingredients to problem solving. That is, every mathematical problem has a formula or set algorithm which can aid in finding a solution. Unfortunately, we will find that not every problem in mathematics possesses a sequence of steps or instructions somewhere in print. Sometimes, a bit of creativity and free thought is the only way to a solution.
Creativity is rarely a factor in traditional mathematical problem solving. Usually, one simply "applies a formula here," "takes the derivative there," and uses the algorithm to solve the rest. Performing this procedure over a span of several years can easily form the bad habit of "searching for the right steps" instead of actually "thinking it through".
In the problems that follow, traditional problem solvers will likely give traditional answers. That is, some of these problems have more than one correct answer, but the traditional problem solver will only be able to get one of them. The creative thinker, on the other hand, will be able to get the traditional answers as well as some of the others.
Question 1: What is half of eleven?
Question 2: What is 1 / 2 + 1 / 3 ?
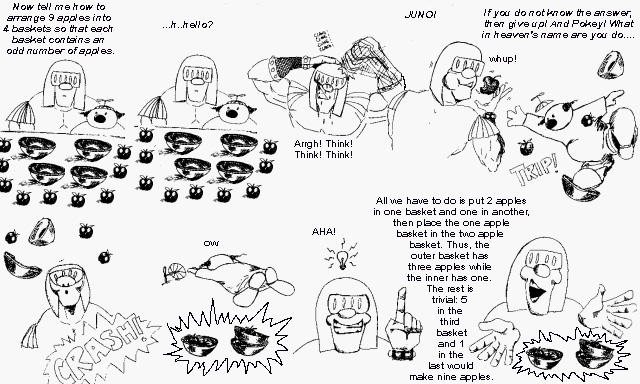
Question 3: Arrange 9 apples in 4 baskets so that there are odd numbers of apples in each basket.
(These questions are examples brought forth by Dr. Allen Klinger)
These may seem easy, and to the traditional thinker, they are. Why? Because for them, there is only one answer. In actuality, each question has more than one answer.
The effectiveness of a visual can determine the level of a student's understanding. Weak and sparse figures within text can cause confusion amongst readers. If a figure exists, it must be powerful and thorough. Anything less would be ineffective and even detrimental. If a reader had erroneous ideas about the contents of a particular text, then the figure would have to be able to clear any misconceptions. In other words, the visual would have to be self contained to a point that the reader would be able to pair the text to the visual and gain a full understanding of the concepts. The text can then serve to describe the visual in further detail, and form arguments from its contents. Dr. Klinger often stresses that the key to writing a paper lies within the descriptions and elaborations of figures and visuals.
Often times, text can become monotonous and boring. In these cases, even simple visuals such as separators (lines and bullets) can help to emphasize the text and capture a reader's attention. Obviously, if the text is naturally stimulating, as in most novels, a reader will have no problem understanding and absorbing without visuals. In many factual or mathematically based pieces, however, reading can become tedious at times. As a simple example, look at the documents written by Dr. Klinger (Appendix B-1, Appendix B-2). At first glance, these documents can easily discourage a passing reader with their relative lengths. Now look at a modified version of Appendix B-2 (Appendix B-3). This is the same document, but aesthetically modified ; the background makes the document seem more lively and interesting. By simply separating the text into sections and making the background a bit more active, the document appears less daunting, shorter in length, and easier to read and absorb. In actuality, the content of the text remains unchanged. The separations also help to highlight more the important facts or ideas that express the main idea of the text. In this case, we separated the quotes so that the reader would recognize their significance.
When documents such as these pass on to younger generations, they become essentially useless. Children would never be able to sit through and read text of this magnitude and complexity! Their attention spans just would not allow it. To encourage participation and learning from this group, we must appeal to them in some way. Children naturally flock to superficial stimuli, so we must rely on our effectiveness in presentation; namely, in our visual designs to win them over.
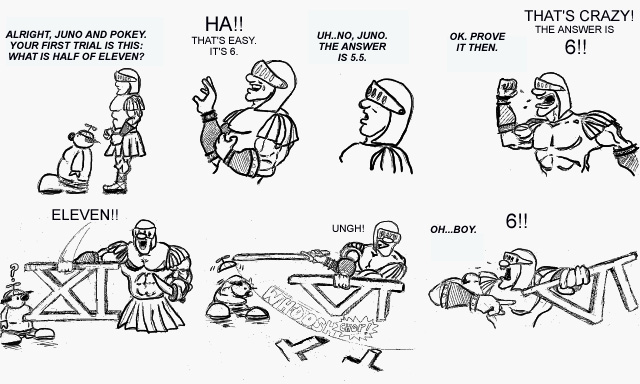
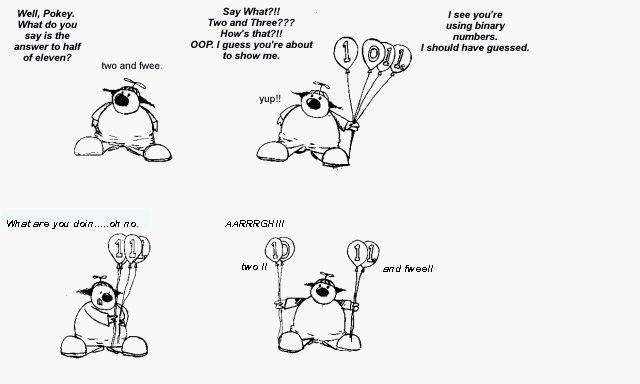
Since figures and visuals make learning and understanding easier, I attempted to make a set of "pure" visuals to supplement Dr. Klinger's mathematical concepts and make them accessible to youth. In order for a visual to be "pure," it would have to be self contained. But can a visual really be fully self contained? See for yourself. I created a comic strip that involved the adventures of two clever (yet idiotic) characters and their mathematical "conquests" named "The Trials of Juno and Pokey" (Appendix C-1,C-2, C-3,C-4). These strips present mathematical problems and solve them within each sequence. Trial 1 (Appendix C-1) solves the problem "What is half of eleven"; Trial 2 (Appendix C-2) builds off of Trial 1 and solves the same problem a different way. Trial 3 (Appendix C-3) involves baseball arithmetic, and Trial 4 (Appendix C-4) solves the problem, "Arrange nine apples in four baskets so that each basket contains an odd number of apples." By combining the fun of the "Sunday funnies" and the concepts of math, we could make learning a whole new experience!
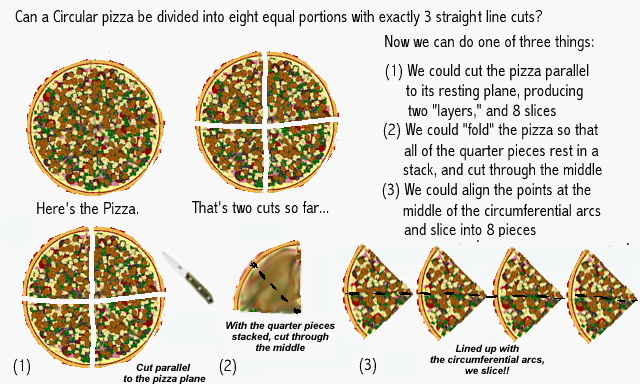
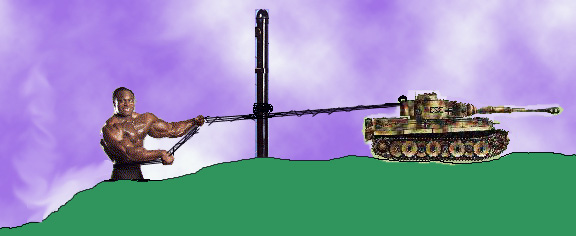
Other "pure" visuals include Figures 1 and 2 ( Appendix D-1, D-2 ). Figure 1 is a visual that explains the correct answer to a question that was presented on a PSAT a few years ago. The solution that the Educational Testing Service (ETS) thought was correct was, in fact, wrong. Figure 2 is a visual explaining the multiple answers to the question: "Can you divide a circular pizza into eight equal portions with only three straight line cuts?" These visuals are intended to be figures like those in a high school paper or textbook. Figures 3 and 4 (Appendix E-1, E-2) are supplemental visuals . Figure 3 is simply a representation of the problem :
" A tank attached to a chain is attempting to tow a person holding the other end of it. The chain is wrapped three times completely around a metal pole that is permanently anchored. The person pulls with force of ten pounds. The tank pulls with the force of ten thousand pounds. Does the tank pull the chain out of the hands of the person? Show your reasons." These four visuals have a slightly more serious tone to them, but still have the power to appeal to all age groups. All visuals were based on mathematical problems and concepts brought forth by Dr. Allen Klinger.
All of these visuals provide a foundation which one can build upon and expand. Child learning is beginning at such early stages now, and advanced concepts are not so far out of reach anymore. With the production of more learning tools such as "pure" visuals, children can begin to understand complex issues in a fun and enthusiastic manner at even earlier stages of life.
Scenario: Elementary school children can learn geometry through numerous cartoons teaching the relationships of angles and shapes, compliments of "Juno and Pokey!" teachers and instructors will assign homework, "Look over the comic strips on pages 23 and 24, and finish the exercises presented in comic strips 54 and 55 for tomorrow!" doing homework would actually be fun!This scenario may be a far-fetched vision in terms of the way things are today, but it is far from impossible. With a little free thinking , creativity, and a lot of hard work, this "vision" can become a reality.
Pythagorean Theorem
 The Pythagorean theorem was first known in ancient
Babylon and Egypt (beginning about 1900 B.C.). The relationship was shown
on a 4000 year old Babylonian tablet now known as Plimpton 322. However,
the relationship was not widely publicized until Pythagoras stated it
explicitly.
The Pythagorean theorem was first known in ancient
Babylon and Egypt (beginning about 1900 B.C.). The relationship was shown
on a 4000 year old Babylonian tablet now known as Plimpton 322. However,
the relationship was not widely publicized until Pythagoras stated it
explicitly.
 Pythagoras lived
during the 6th century B.C. on the island of Samos in the Aegean Sea. He also lived in
Egypt, Babylon and southern Italy. Pythagoras was a teacher and a philosopher.
Pythagoras lived
during the 6th century B.C. on the island of Samos in the Aegean Sea. He also lived in
Egypt, Babylon and southern Italy. Pythagoras was a teacher and a philosopher.
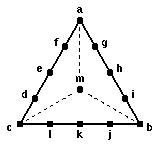
Pythagoras found out that for a right angle triangle (with one of the angles being 90o), the square of the hypotenuse is equal to the sum of the squares of the other two sides: a2+b2=c2.
In other words, the green square's area (with area c2) equals the sum of two others. It is exactly the yellow square's area (a2) plus the blue square's (c2).
Now take a look at the tile pattern.
[The proof of Pythagorean Theorem is in the following figure.]
Count the triangles within the squares. The number of green triangles equals the total of those that are yellow and blue!
Do You Know ...
Archeologists use the Pythagorean in field excavations. When they start a dig, they place a rectangular grid over the site surface. To lay out an accurate grid system, archeologists use the Theorem, X 2+Y2=Z2. After deciding how long the baselines (X- and Y- axis) should be, the proper length of the diagonal is calculated using the Pythagorean theorem to make sure the quadrant is a rectangle and not a lopsided parallelogram. Corner stakes will then be placed to mark the accurate location of the site.
An overlaying rectangular grid is a use of the mathematical idea called Cartesian coordinate system.
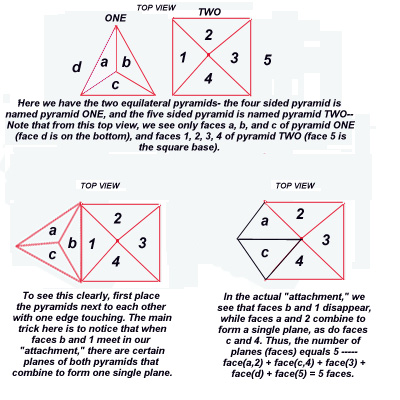
Pieces of shapes can be combined to form different 3-dimensional objects in spaces.
Get some equilateral triangles.
 Try taping the edges of 3 equilateral triangles around a point.
You get a convex tent (tetrahedron).
 How about taping 4 or 5 triangles together?
You still get convex tents, but with different shapes (square pyramid, pentagonal pyramid).
 Try using 6 triangles.
You get a flat surface!
 How about 7or 8 triangles?
The surface ripples up and down.
 Triangles can also form other shapes such as a dome...
The Secret ...
What condition is for the taped-together shape to lie flat?
The trick is the sum of the angles around the point: if the sum equals to 360o, you'll get a flat surface.
In our case, each angle of a equilateral triangle is 60o, so we need 6 triangles to form a flat surface (6*60o = 360o). Otherwise, the shape will be floppy!
I used the concepts of CGI to produce a guest book application that would enable users to enter contact information and suggestions onto the web. I produced the application using the "FORM" tag with "METHOD=POST" of HTML to create the entry form (See Appendix F-1), and parsed the form data submission with C code (See Appendix F-2 for the code). The C code also enabled HTML creation "on the fly" from the data so that we could see the guest book submissions immediately. The resulting page for the form is displayed in Appendix F-3, and the current guest book contents is displayed in Appendix F-4.
The guest book is significant not only through its communication uses, but also through its ability to spread contacts. For example, interested users of the CS190 web site could contact others of the same interest just by viewing the guest list and noting the e-mail addresses listed. Users also tend to develop an "attachment" to a site after they have signed in, knowing that their names are now permanently a part of that particular site. This psychological factor contributes in developing a client base.
Given more time, I would like to create a CGI based system which would allow users to fill out the quizzes and tests that Dr. Klinger has available on-line. The system could also create an HTML document after the submission that would give the results and score of the submitted test immediately. This would give the site a more interactive feel, and would also encourage user interest and participation. The system would also have a search engine that could search the documents for a particular subject.
DRAWINGS |
 PAINTINGS |
Each of the following images is a link to a mathematical problem or concept presented and explained--just click on each image to view--
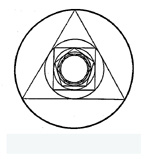
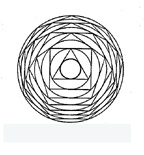
Adding or multiplying numbers when there is no last item is a little
like the idea of the rabbit trying to catch a snail who has a one mile
head start. The puzzle goes that while the rabbit runs to the half-mile point
the snail moves forward. That means that when the rabbit makes it to the
three-quarter mile point, the seven-eighths marker, etc., there always
will be distance remaining to catch the snail. The same kind of
reasoning led to the view that the continually-smaller circles inside
the increasing-number-of-side polygons in the following figure get to a
smallest circle ... if we go far enough in the process. This idea is
called limit in mathematics.
 |
 |
 Four and Five Sided |
There are many mathematical ideas joined to special symbols used to concisely portray them (once they've been understood). One is the ratio of the length of the boundary or circumference of a circle to its diameter, the line through the circle center which defines its widest crossing. That quantity is called p and pronounced by the sound pi.
Finding p to greater accuracy was a significant task in mathematics up to a few hundred years ago.
Adding or multiplying numbers when there is no last item ... a situation usually summarized in a shorthand way by the word infinite, leads to two special symbols. The first represents addition; it is: S . The second uses a special symbol to represent multiplication, P


